With over six years of experience in a molecular biology laboratory, I designed and developed this inventory for stock reagents and supplies.
Key Tools Utilized:
Pivot tables;
Slicers;
Conditional formatting;
Macros;
Hyperlinks
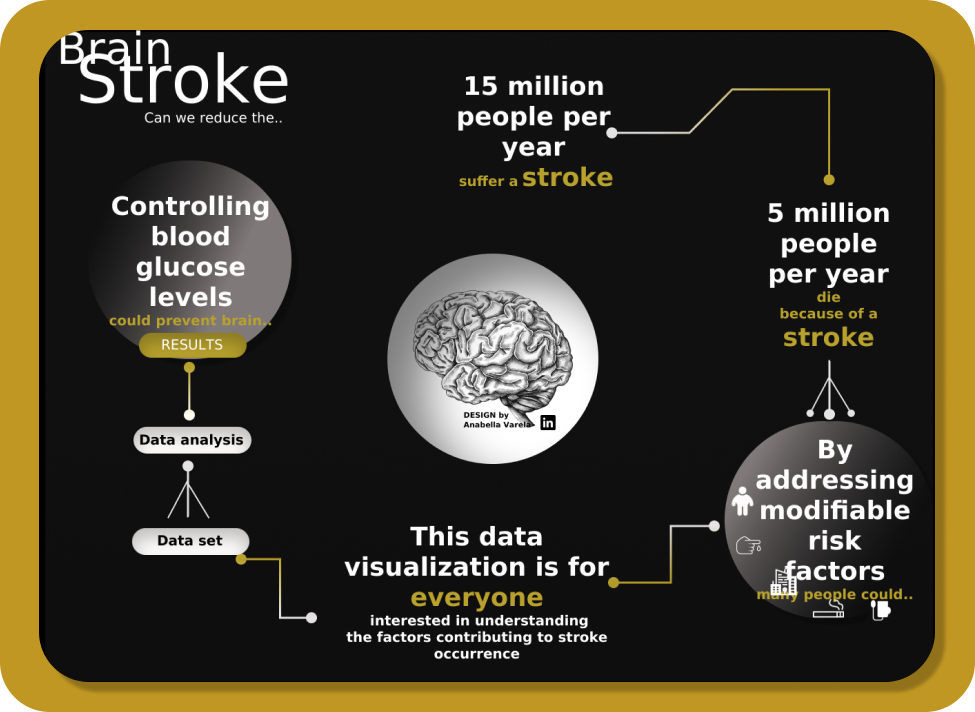 I crafted a dashboard using the Brain Stroke dataset sourced from Kaggle. This project showcases a blend of storytelling and design skills, aimed at producing a visually engaging and enlightening data-driven experience.

Here you will find SQL commands to retrieve data from different databases. I used:
String,Numeric and Date functions; Aggregate functions; Subqueries;
Joins and
Unions
 Exploratory Data Analysis performed with R
With a small dataset I manage to perform several data analysis:
Used 7 Libraries,
Generated 6 visualizations,
Made a ANOVA and LSD Fisher's tests

Here you will see my python learning log. At the moment just learning basic python. Will start with pandas and other libraries